
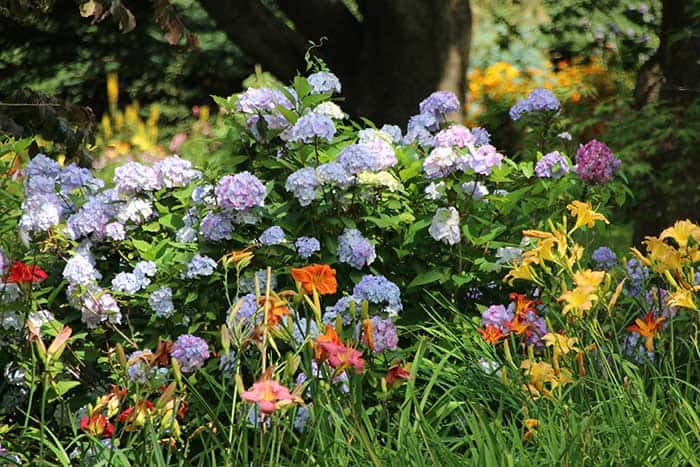
The Garden Making bloom chart will help you keep track of when plants in your garden are in flower, showing you when there are gaps in bloom. It can be an important tool in achieving succession of bloom in your garden design. Using a bloom chart for individual areas will also be a help in colour design, allowing you to better plan beds devoted to monochromatic schemes, such as white or mauve sections of the garden, or more intricate combinations of pink, lavender and silver, for example.
The bloom chart provides places for you to write in plant names down the right side and columns for the weeks in spring, summer and fall months are listed across the top. First, list the flowering trees, shrubs, perennials, vines and bulbs you already have. Gather any memories, photos and notes you have, because this initial survey will be your key to starting a record of flowering schedules.
As each plant begins to flower, mark the weeks it’s in bloom on the chart. For example, if daffodils begin to bloom the second week of April and last until the second week in May; check off those four corresponding boxes on the chart, next to the entry for daffodils.
Your plant survey and the resulting master list not only shows what specimens you have growing and when they flower, it also reveals the time periods when there’s nothing in bloom. Once the bloom-time chart is filled in, it will be possible to pinpoint short periods of time when nothing is in bloom; for instance, the first 10 days of October, when there’s a slight gap as chrysanthemums fade and late black-leaved cimicifuga isn’t quite out. To bridge that gap will be a research challenge. Plant encyclopedias, good nursery catalogues and Internet sources list the bloom times for perennials and these resources will help you decide on plants to add next year to fill in the gaps.
When using reference materials, remember to factor in your hardiness zone, both in plant selections and in bloom-time adjustment. Perennials adapt to seasonal temperatures, coming into flower earlier in warmer zones (Zones 5 and 6), and later in Zone 4 and lower. In colder zones, winter conditions stay later in spring and hard frost comes earlier in autumn, shortening the growing season.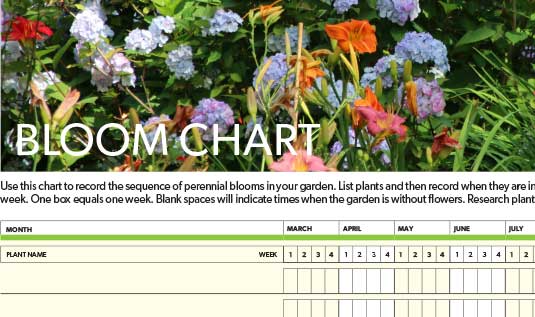
With good record keeping and careful research, you can achieve a full succession of bloom in just a couple of growing seasons.
[hide_from visible_to=”public”]
Email registration is required.
Please login or register below to view and save the planting plans including the plant lists.
[checkout_form product_id=”64262″ account_box_heading=”Bloom Chart” nonmember_text_free=”Register Now” already_purchased_text=”You’ve already registered.” account_box_heading=”Please register with email and name.”]
[/hide_from]
[hide_from visible_to=”member”]
As a registered Garden Making member, you can download the PDF.
For optimal viewing of colours in the PDF, we recommend the free Adobe Reader available here.
Get your free Bloom Chart, [member_first_name]!
Click to download the Bloom Chart now
[/hide_from]
Fill in the Bloom Chart on your mobile device
The Bloom Chart PDF file can be opened on an iPad or other mobile device and completed in your garden. Download the Adobe Fill & Sign DC app (link for App store or link for Android apps on Google Play) and then open the Bloom Chart with the app.


This tool looks like one that will be super for me in my new gardening planning endeavors. Sadly after more than a dozen attempts to download the pdf or access the file somehow on both my MacBook (safari) and my android, I am not able to see the chart. I have subscribed and signed up. Please advise. Thank you for this work!
The Bloom Chart PDF file can be opened on an iPad or other mobile device and completed in your garden. Download the Adobe Fill & Sign DC app (link for App store or link for Android apps on Google Play) and then open the Bloom Chart with the app.
Penny,
That’s a great idea.
Right now, we’re just providing a PDF that we expected people to print out and fill in by hand.
However, we will look at updating it to a version that could be typed into as a form.
Thanks for the suggestion!
I too am having trouble with this. I managed to download the bloom chart. What I would like to be able to do is to take my tablet with me to the garden and input directly to the chart. When I try to type something in I am told that web notes are not available. What am I doing wrong. Any help would be greatly appreciated
I am a subscriber but keep receiving a message ( i do not have access to this content) when i try to download the Bloom chart. Please help.
Thanks
Eleanor
I apologize. There was a glitch, but this should work now.
This sounds like a wonderful garden tool but after clicking on the Bloom Chart now download several times I was told each time that I did not have access to that file! There seems to be a glitch!
Hope it can be fixed!
Thanks BM
I apologize. There was a glitch, but this should work now.